|
Download Data (XLS File) |
|
|||||
|
|||||
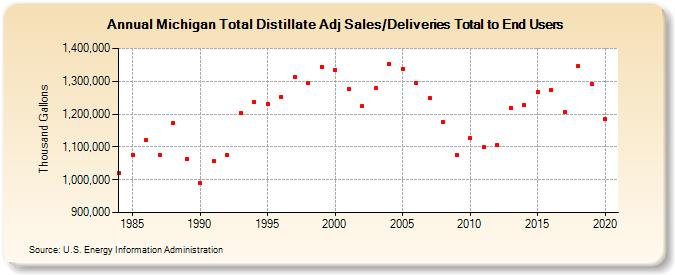
| Michigan Total Distillate Adj Sales/Deliveries Total to End Users (Thousand Gallons) | |||||
| Decade | Year-0 | Year-1 | Year-2 | Year-3 | Year-4 | Year-5 | Year-6 | Year-7 | Year-8 | Year-9 |
|---|---|---|---|---|---|---|---|---|---|---|
| 1980's | 1,019,827 | 1,076,266 | 1,121,014 | 1,075,846 | 1,173,490 | 1,063,066 | ||||
| 1990's | 988,833 | 1,056,838 | 1,075,392 | 1,203,706 | 1,236,817 | 1,230,538 | 1,253,082 | 1,312,628 | 1,295,547 | 1,344,402 |
| 2000's | 1,334,924 | 1,275,348 | 1,223,155 | 1,279,268 | 1,353,470 | 1,338,635 | 1,293,878 | 1,247,829 | 1,175,844 | 1,076,011 |
| 2010's | 1,126,060 | 1,100,498 | 1,106,585 | 1,219,050 | 1,227,496 | 1,266,949 | 1,273,435 | 1,205,546 | 1,346,248 | 1,292,472 |
| 2020's | 1,184,431 |
| - = No Data Reported; -- = Not Applicable; NA = Not Available; W = Withheld to avoid disclosure of individual company data. |
| Release Date: 2/9/2022 |
| Next Release Date: Suspended |