|
Download Data (XLS File) |
|
|||||
|
|||||
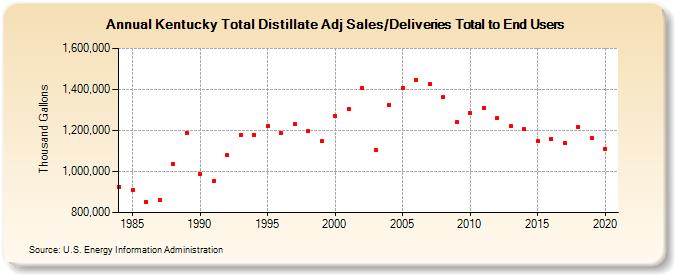
| Kentucky Total Distillate Adj Sales/Deliveries Total to End Users (Thousand Gallons) | |||||
| Decade | Year-0 | Year-1 | Year-2 | Year-3 | Year-4 | Year-5 | Year-6 | Year-7 | Year-8 | Year-9 |
|---|---|---|---|---|---|---|---|---|---|---|
| 1980's | 926,544 | 912,307 | 853,056 | 862,991 | 1,037,117 | 1,188,945 | ||||
| 1990's | 985,780 | 954,053 | 1,079,081 | 1,177,850 | 1,179,721 | 1,221,094 | 1,187,407 | 1,229,849 | 1,198,558 | 1,146,533 |
| 2000's | 1,269,266 | 1,304,501 | 1,407,900 | 1,105,891 | 1,324,260 | 1,408,496 | 1,447,053 | 1,425,653 | 1,362,456 | 1,240,052 |
| 2010's | 1,287,490 | 1,310,992 | 1,261,556 | 1,221,688 | 1,205,758 | 1,148,959 | 1,158,721 | 1,139,187 | 1,218,292 | 1,165,485 |
| 2020's | 1,111,625 |
| - = No Data Reported; -- = Not Applicable; NA = Not Available; W = Withheld to avoid disclosure of individual company data. |
| Release Date: 2/9/2022 |
| Next Release Date: Suspended |