|
Download Data (XLS File) |
|
|||||
|
|||||
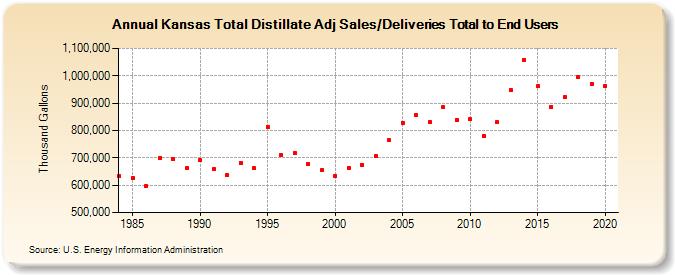
| Kansas Total Distillate Adj Sales/Deliveries Total to End Users (Thousand Gallons) | |||||
| Decade | Year-0 | Year-1 | Year-2 | Year-3 | Year-4 | Year-5 | Year-6 | Year-7 | Year-8 | Year-9 |
|---|---|---|---|---|---|---|---|---|---|---|
| 1980's | 632,837 | 628,059 | 596,455 | 699,033 | 696,175 | 662,271 | ||||
| 1990's | 693,723 | 658,133 | 635,477 | 681,333 | 661,031 | 813,975 | 711,727 | 718,280 | 676,590 | 654,888 |
| 2000's | 634,559 | 664,570 | 674,784 | 706,074 | 763,835 | 828,787 | 854,825 | 830,345 | 884,625 | 839,798 |
| 2010's | 840,673 | 780,318 | 829,894 | 947,125 | 1,059,176 | 960,794 | 886,212 | 920,978 | 995,453 | 970,971 |
| 2020's | 963,638 |
| - = No Data Reported; -- = Not Applicable; NA = Not Available; W = Withheld to avoid disclosure of individual company data. |
| Release Date: 2/9/2022 |
| Next Release Date: Suspended |