|
Download Data (XLS File) |
|
|||||
|
|||||
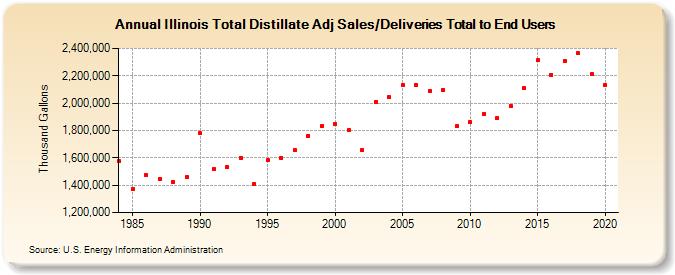
| Illinois Total Distillate Adj Sales/Deliveries Total to End Users (Thousand Gallons) | |||||
| Decade | Year-0 | Year-1 | Year-2 | Year-3 | Year-4 | Year-5 | Year-6 | Year-7 | Year-8 | Year-9 |
|---|---|---|---|---|---|---|---|---|---|---|
| 1980's | 1,574,386 | 1,371,241 | 1,473,068 | 1,444,273 | 1,419,887 | 1,457,021 | ||||
| 1990's | 1,778,727 | 1,518,379 | 1,530,052 | 1,599,722 | 1,410,466 | 1,581,339 | 1,601,145 | 1,656,552 | 1,763,105 | 1,832,984 |
| 2000's | 1,846,042 | 1,801,596 | 1,656,323 | 2,011,400 | 2,041,864 | 2,131,739 | 2,133,083 | 2,089,116 | 2,098,751 | 1,831,614 |
| 2010's | 1,859,862 | 1,920,824 | 1,889,572 | 1,977,678 | 2,110,230 | 2,313,149 | 2,207,786 | 2,308,549 | 2,363,068 | 2,211,095 |
| 2020's | 2,131,745 |
| - = No Data Reported; -- = Not Applicable; NA = Not Available; W = Withheld to avoid disclosure of individual company data. |
| Release Date: 2/9/2022 |
| Next Release Date: Suspended |