|
Download Data (XLS File) |
|
|||||
|
|||||
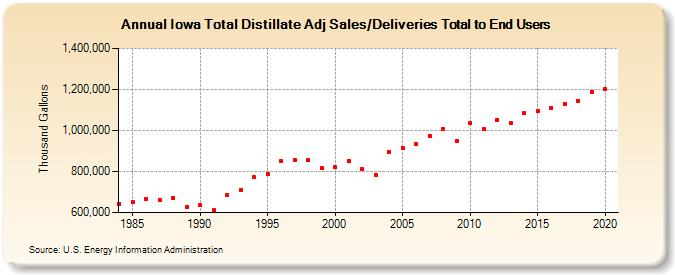
| Iowa Total Distillate Adj Sales/Deliveries Total to End Users (Thousand Gallons) | |||||
| Decade | Year-0 | Year-1 | Year-2 | Year-3 | Year-4 | Year-5 | Year-6 | Year-7 | Year-8 | Year-9 |
|---|---|---|---|---|---|---|---|---|---|---|
| 1980's | 643,171 | 649,354 | 667,727 | 661,491 | 673,021 | 628,372 | ||||
| 1990's | 636,739 | 610,722 | 686,882 | 710,146 | 773,552 | 789,789 | 848,848 | 857,618 | 854,491 | 818,814 |
| 2000's | 820,585 | 853,452 | 811,400 | 785,267 | 896,936 | 915,832 | 932,307 | 972,679 | 1,007,851 | 947,758 |
| 2010's | 1,037,059 | 1,006,467 | 1,052,747 | 1,037,244 | 1,083,073 | 1,095,423 | 1,111,214 | 1,130,580 | 1,144,472 | 1,186,316 |
| 2020's | 1,200,188 |
| - = No Data Reported; -- = Not Applicable; NA = Not Available; W = Withheld to avoid disclosure of individual company data. |
| Release Date: 2/9/2022 |
| Next Release Date: Suspended |