|
Download Data (XLS File) |
|
|||||
|
|||||
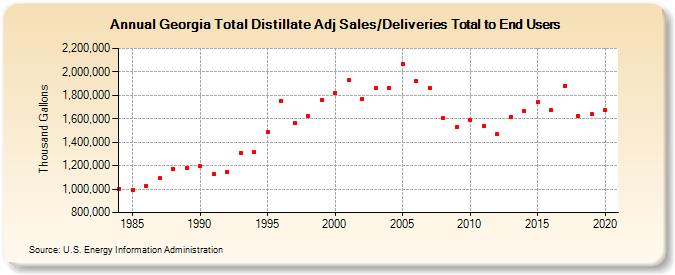
| Georgia Total Distillate Adj Sales/Deliveries Total to End Users (Thousand Gallons) | |||||
| Decade | Year-0 | Year-1 | Year-2 | Year-3 | Year-4 | Year-5 | Year-6 | Year-7 | Year-8 | Year-9 |
|---|---|---|---|---|---|---|---|---|---|---|
| 1980's | 1,002,347 | 994,396 | 1,030,158 | 1,092,293 | 1,171,711 | 1,183,830 | ||||
| 1990's | 1,195,940 | 1,130,399 | 1,144,146 | 1,308,575 | 1,319,143 | 1,483,349 | 1,752,673 | 1,564,457 | 1,623,075 | 1,762,001 |
| 2000's | 1,823,226 | 1,926,965 | 1,770,187 | 1,859,678 | 1,863,408 | 2,068,775 | 1,922,701 | 1,865,281 | 1,608,066 | 1,527,491 |
| 2010's | 1,589,145 | 1,538,602 | 1,465,681 | 1,617,964 | 1,664,034 | 1,744,976 | 1,671,318 | 1,877,857 | 1,625,032 | 1,637,457 |
| 2020's | 1,675,153 |
| - = No Data Reported; -- = Not Applicable; NA = Not Available; W = Withheld to avoid disclosure of individual company data. |
| Release Date: 2/9/2022 |
| Next Release Date: Suspended |