|
Download Data (XLS File) |
|
|||||
|
|||||
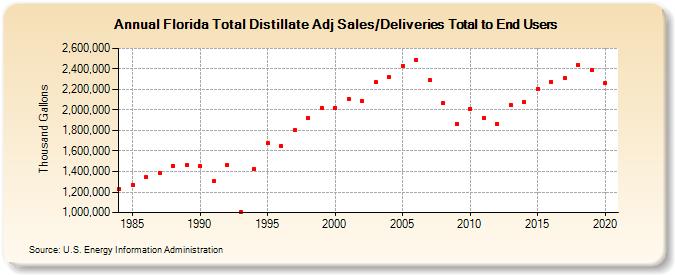
| Florida Total Distillate Adj Sales/Deliveries Total to End Users (Thousand Gallons) | |||||
| Decade | Year-0 | Year-1 | Year-2 | Year-3 | Year-4 | Year-5 | Year-6 | Year-7 | Year-8 | Year-9 |
|---|---|---|---|---|---|---|---|---|---|---|
| 1980's | 1,226,821 | 1,273,428 | 1,342,043 | 1,384,330 | 1,457,996 | 1,461,804 | ||||
| 1990's | 1,451,361 | 1,302,827 | 1,463,171 | 1,007,005 | 1,424,578 | 1,674,266 | 1,650,490 | 1,803,418 | 1,922,092 | 2,023,831 |
| 2000's | 2,022,322 | 2,109,900 | 2,089,412 | 2,270,789 | 2,316,448 | 2,429,373 | 2,489,427 | 2,293,268 | 2,063,558 | 1,863,564 |
| 2010's | 2,011,703 | 1,920,952 | 1,866,770 | 2,051,248 | 2,080,048 | 2,205,777 | 2,275,227 | 2,308,850 | 2,442,051 | 2,390,264 |
| 2020's | 2,259,058 |
| - = No Data Reported; -- = Not Applicable; NA = Not Available; W = Withheld to avoid disclosure of individual company data. |
| Release Date: 2/9/2022 |
| Next Release Date: Suspended |