|
Download Data (XLS File) |
|
|||||
|
|||||
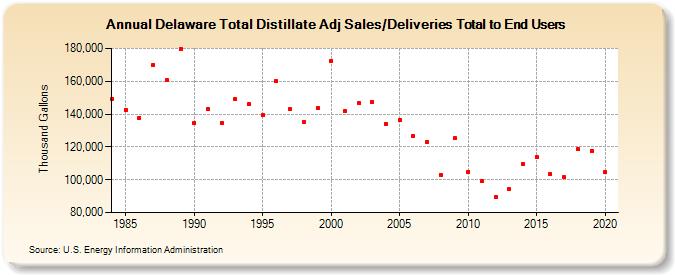
| Delaware Total Distillate Adj Sales/Deliveries Total to End Users (Thousand Gallons) | |||||
| Decade | Year-0 | Year-1 | Year-2 | Year-3 | Year-4 | Year-5 | Year-6 | Year-7 | Year-8 | Year-9 |
|---|---|---|---|---|---|---|---|---|---|---|
| 1980's | 149,356 | 142,707 | 137,819 | 169,983 | 160,738 | 179,727 | ||||
| 1990's | 134,454 | 142,920 | 134,707 | 149,097 | 145,918 | 139,397 | 160,039 | 142,849 | 135,320 | 143,785 |
| 2000's | 172,570 | 141,728 | 146,654 | 147,342 | 134,096 | 136,538 | 126,714 | 123,043 | 103,063 | 125,149 |
| 2010's | 104,907 | 99,004 | 89,279 | 94,205 | 109,605 | 113,780 | 103,466 | 101,430 | 118,742 | 117,659 |
| 2020's | 104,672 |
| - = No Data Reported; -- = Not Applicable; NA = Not Available; W = Withheld to avoid disclosure of individual company data. |
| Release Date: 2/9/2022 |
| Next Release Date: Suspended |