|
Download Data (XLS File) |
|
|||||
|
|||||
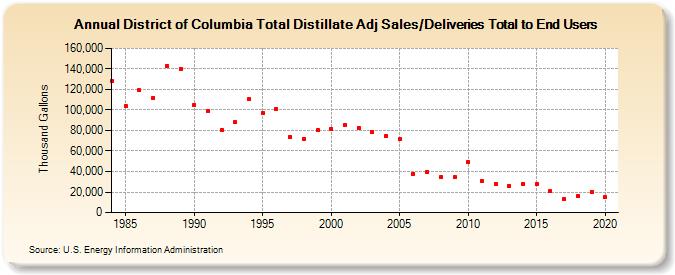
| District of Columbia Total Distillate Adj Sales/Deliveries Total to End Users (Thousand Gallons) | |||||
| Decade | Year-0 | Year-1 | Year-2 | Year-3 | Year-4 | Year-5 | Year-6 | Year-7 | Year-8 | Year-9 |
|---|---|---|---|---|---|---|---|---|---|---|
| 1980's | 128,288 | 104,011 | 119,063 | 112,055 | 143,240 | 140,261 | ||||
| 1990's | 105,061 | 99,253 | 80,499 | 87,809 | 110,238 | 97,189 | 100,984 | 73,903 | 72,103 | 80,340 |
| 2000's | 81,906 | 85,317 | 82,824 | 78,402 | 74,785 | 71,375 | 37,818 | 39,545 | 34,433 | 34,502 |
| 2010's | 49,477 | 30,851 | 27,983 | 26,196 | 28,000 | 27,911 | 20,598 | 12,964 | 16,577 | 20,164 |
| 2020's | 14,813 |
| - = No Data Reported; -- = Not Applicable; NA = Not Available; W = Withheld to avoid disclosure of individual company data. |
| Release Date: 2/9/2022 |
| Next Release Date: Suspended |