|
Download Data (XLS File) |
|
|||||
|
|||||
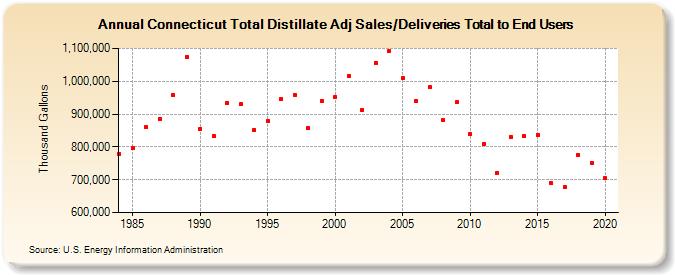
| Connecticut Total Distillate Adj Sales/Deliveries Total to End Users (Thousand Gallons) | |||||
| Decade | Year-0 | Year-1 | Year-2 | Year-3 | Year-4 | Year-5 | Year-6 | Year-7 | Year-8 | Year-9 |
|---|---|---|---|---|---|---|---|---|---|---|
| 1980's | 778,847 | 795,359 | 861,057 | 885,432 | 957,661 | 1,073,210 | ||||
| 1990's | 854,795 | 833,364 | 934,078 | 929,474 | 852,899 | 879,564 | 945,920 | 958,833 | 856,900 | 939,812 |
| 2000's | 953,323 | 1,016,542 | 913,412 | 1,056,058 | 1,092,962 | 1,010,297 | 940,563 | 981,703 | 882,146 | 936,339 |
| 2010's | 838,995 | 809,272 | 720,583 | 831,056 | 832,774 | 837,225 | 688,644 | 678,516 | 776,164 | 751,039 |
| 2020's | 703,858 |
| - = No Data Reported; -- = Not Applicable; NA = Not Available; W = Withheld to avoid disclosure of individual company data. |
| Release Date: 2/9/2022 |
| Next Release Date: Suspended |