|
Download Data (XLS File) |
|
|||||
|
|||||
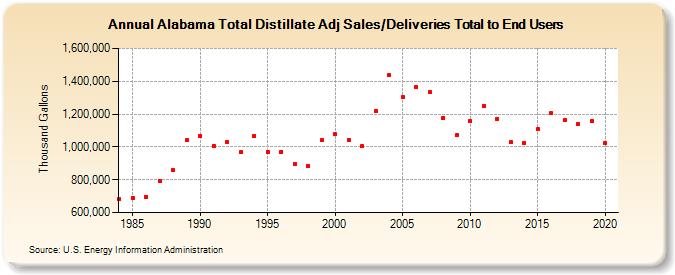
| Alabama Total Distillate Adj Sales/Deliveries Total to End Users (Thousand Gallons) | |||||
| Decade | Year-0 | Year-1 | Year-2 | Year-3 | Year-4 | Year-5 | Year-6 | Year-7 | Year-8 | Year-9 |
|---|---|---|---|---|---|---|---|---|---|---|
| 1980's | 682,201 | 688,871 | 697,038 | 793,189 | 857,636 | 1,039,092 | ||||
| 1990's | 1,069,310 | 1,006,018 | 1,028,073 | 966,995 | 1,068,369 | 971,354 | 971,175 | 894,543 | 884,473 | 1,039,526 |
| 2000's | 1,075,604 | 1,043,397 | 1,002,421 | 1,217,132 | 1,437,315 | 1,302,956 | 1,362,502 | 1,332,305 | 1,175,255 | 1,069,962 |
| 2010's | 1,157,435 | 1,250,613 | 1,171,933 | 1,027,070 | 1,024,181 | 1,107,330 | 1,204,325 | 1,162,872 | 1,137,869 | 1,158,578 |
| 2020's | 1,021,913 |
| - = No Data Reported; -- = Not Applicable; NA = Not Available; W = Withheld to avoid disclosure of individual company data. |
| Release Date: 2/9/2022 |
| Next Release Date: Suspended |