|
Download Data (XLS File) |
|
|||||
|
|||||
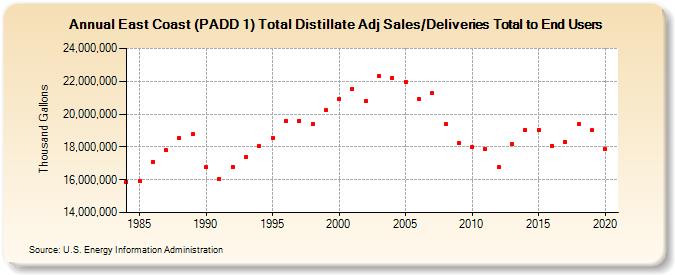
| East Coast (PADD 1) Total Distillate Adj Sales/Deliveries Total to End Users (Thousand Gallons) | |||||
| Decade | Year-0 | Year-1 | Year-2 | Year-3 | Year-4 | Year-5 | Year-6 | Year-7 | Year-8 | Year-9 |
|---|---|---|---|---|---|---|---|---|---|---|
| 1980's | 15,886,038 | 15,919,176 | 17,108,532 | 17,786,034 | 18,570,384 | 18,773,874 | ||||
| 1990's | 16,756,362 | 16,063,026 | 16,791,894 | 17,372,880 | 18,042,570 | 18,566,604 | 19,581,618 | 19,592,916 | 19,392,996 | 20,225,730 |
| 2000's | 20,905,962 | 21,548,814 | 20,781,348 | 22,336,020 | 22,216,488 | 21,959,994 | 20,928,264 | 21,274,722 | 19,378,002 | 18,219,180 |
| 2010's | 17,965,794 | 17,864,868 | 16,754,388 | 18,184,740 | 19,051,872 | 19,022,934 | 18,074,658 | 18,301,122 | 19,366,578 | 19,007,730 |
| 2020's | 17,852,100 |
| - = No Data Reported; -- = Not Applicable; NA = Not Available; W = Withheld to avoid disclosure of individual company data. |
| Release Date: 2/9/2022 |
| Next Release Date: Suspended |