|
Download Data (XLS File) |
|
|||||
|
|||||
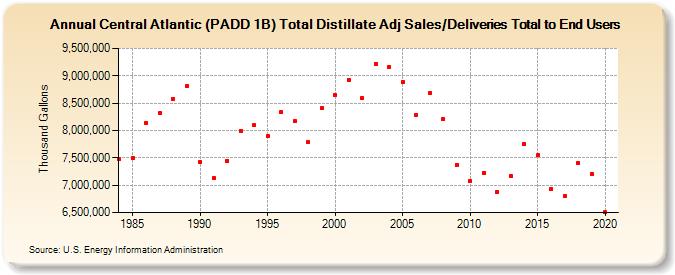
| Central Atlantic (PADD 1B) Total Distillate Adj Sales/Deliveries Total to End Users (Thousand Gallons) | |||||
| Decade | Year-0 | Year-1 | Year-2 | Year-3 | Year-4 | Year-5 | Year-6 | Year-7 | Year-8 | Year-9 |
|---|---|---|---|---|---|---|---|---|---|---|
| 1980's | 7,482,902 | 7,493,203 | 8,141,666 | 8,316,407 | 8,581,098 | 8,807,488 | ||||
| 1990's | 7,433,002 | 7,132,470 | 7,447,710 | 7,995,486 | 8,092,616 | 7,890,871 | 8,333,782 | 8,171,212 | 7,782,975 | 8,410,395 |
| 2000's | 8,648,836 | 8,931,178 | 8,590,018 | 9,223,399 | 9,166,502 | 8,882,529 | 8,285,710 | 8,688,014 | 8,201,584 | 7,373,670 |
| 2010's | 7,079,601 | 7,230,061 | 6,880,333 | 7,168,431 | 7,755,388 | 7,543,342 | 6,934,582 | 6,797,347 | 7,408,988 | 7,207,859 |
| 2020's | 6,503,926 |
| - = No Data Reported; -- = Not Applicable; NA = Not Available; W = Withheld to avoid disclosure of individual company data. |
| Release Date: 2/9/2022 |
| Next Release Date: Suspended |