|
Download Data (XLS File) |
|
|||||
|
|||||
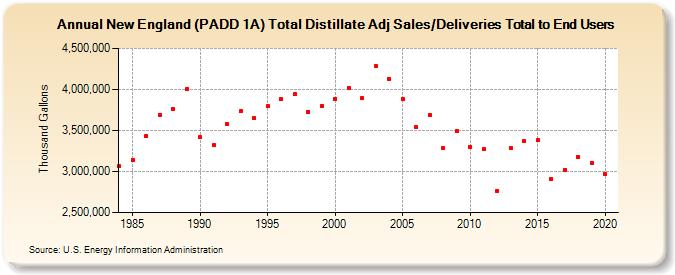
| New England (PADD 1A) Total Distillate Adj Sales/Deliveries Total to End Users (Thousand Gallons) | |||||
| Decade | Year-0 | Year-1 | Year-2 | Year-3 | Year-4 | Year-5 | Year-6 | Year-7 | Year-8 | Year-9 |
|---|---|---|---|---|---|---|---|---|---|---|
| 1980's | 3,063,974 | 3,146,358 | 3,431,141 | 3,693,409 | 3,762,185 | 4,000,264 | ||||
| 1990's | 3,416,293 | 3,317,182 | 3,573,163 | 3,733,912 | 3,651,430 | 3,795,357 | 3,882,213 | 3,940,272 | 3,729,136 | 3,804,050 |
| 2000's | 3,889,205 | 4,022,494 | 3,893,397 | 4,286,261 | 4,131,541 | 3,881,189 | 3,536,836 | 3,689,409 | 3,280,600 | 3,492,293 |
| 2010's | 3,302,105 | 3,273,282 | 2,766,709 | 3,281,567 | 3,366,623 | 3,380,416 | 2,910,361 | 3,023,165 | 3,177,305 | 3,106,572 |
| 2020's | 2,968,429 |
| - = No Data Reported; -- = Not Applicable; NA = Not Available; W = Withheld to avoid disclosure of individual company data. |
| Release Date: 2/9/2022 |
| Next Release Date: Suspended |