|
Download Data (XLS File) |
|
|||||
|
|||||
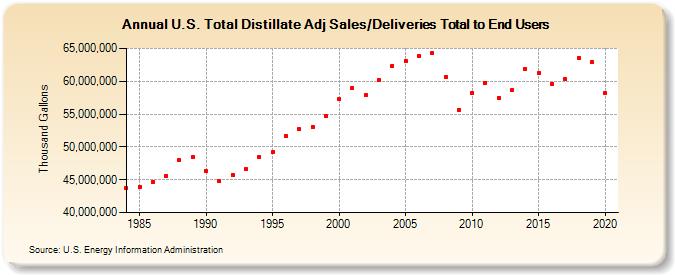
| U.S. Total Distillate Adj Sales/Deliveries Total to End Users (Thousand Gallons) | |||||
| Decade | Year-0 | Year-1 | Year-2 | Year-3 | Year-4 | Year-5 | Year-6 | Year-7 | Year-8 | Year-9 |
|---|---|---|---|---|---|---|---|---|---|---|
| 1980's | 43,731,114 | 43,966,734 | 44,677,080 | 45,629,346 | 47,985,420 | 48,393,450 | ||||
| 1990's | 46,305,126 | 44,775,360 | 45,791,466 | 46,621,806 | 48,477,156 | 49,157,598 | 51,730,518 | 52,665,438 | 53,063,934 | 54,758,718 |
| 2000's | 57,217,230 | 58,971,486 | 57,884,652 | 60,201,666 | 62,383,608 | 63,129,150 | 63,912,660 | 64,323,294 | 60,649,008 | 55,664,448 |
| 2010's | 58,258,830 | 59,769,444 | 57,512,994 | 58,675,008 | 61,890,948 | 61,246,920 | 59,601,108 | 60,280,584 | 63,555,534 | 62,905,920 |
| 2020's | 58,194,738 |
| - = No Data Reported; -- = Not Applicable; NA = Not Available; W = Withheld to avoid disclosure of individual company data. |
| Release Date: 2/9/2022 |
| Next Release Date: Suspended |