|
Download Data (XLS File) |
|
|||||
|
|||||
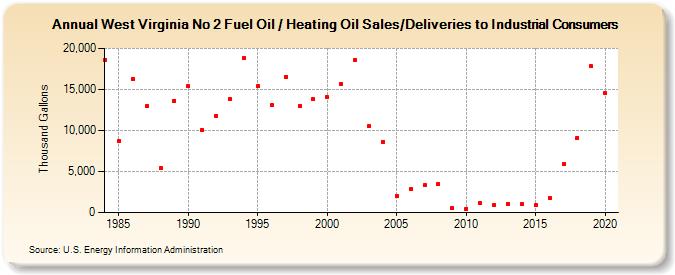
| West Virginia No 2 Fuel Oil / Heating Oil Sales/Deliveries to Industrial Consumers (Thousand Gallons) | |||||
| Decade | Year-0 | Year-1 | Year-2 | Year-3 | Year-4 | Year-5 | Year-6 | Year-7 | Year-8 | Year-9 |
|---|---|---|---|---|---|---|---|---|---|---|
| 1980's | 18,641 | 8,680 | 16,266 | 12,940 | 5,420 | 13,627 | ||||
| 1990's | 15,372 | 10,109 | 11,813 | 13,847 | 18,873 | 15,367 | 13,095 | 16,554 | 12,964 | 13,793 |
| 2000's | 14,041 | 15,689 | 18,610 | 10,524 | 8,631 | 2,078 | 2,867 | 3,316 | 3,481 | 529 |
| 2010's | 464 | 1,123 | 895 | 1,064 | 992 | 879 | 1,779 | 5,895 | 9,119 | 17,816 |
| 2020's | 14,507 |
| - = No Data Reported; -- = Not Applicable; NA = Not Available; W = Withheld to avoid disclosure of individual company data. |
| Release Date: 2/9/2022 |
| Next Release Date: Suspended |