|
Download Data (XLS File) |
|
|||||
|
|||||
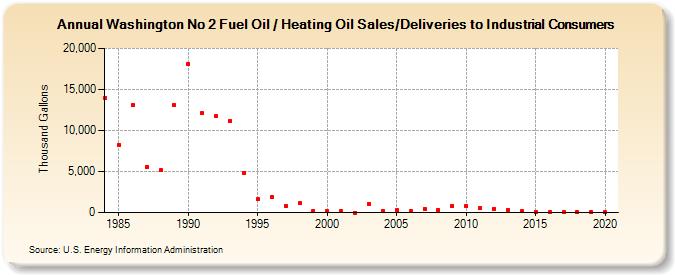
| Washington No 2 Fuel Oil / Heating Oil Sales/Deliveries to Industrial Consumers (Thousand Gallons) | |||||
| Decade | Year-0 | Year-1 | Year-2 | Year-3 | Year-4 | Year-5 | Year-6 | Year-7 | Year-8 | Year-9 |
|---|---|---|---|---|---|---|---|---|---|---|
| 1980's | 14,012 | 8,268 | 13,047 | 5,566 | 5,138 | 13,095 | ||||
| 1990's | 18,130 | 12,095 | 11,721 | 11,165 | 4,830 | 1,595 | 1,880 | 825 | 1,129 | 205 |
| 2000's | 172 | 150 | 0 | 1,070 | 173 | 301 | 146 | 488 | 288 | 833 |
| 2010's | 791 | 536 | 476 | 326 | 135 | 129 | 38 | 22 | 20 | 21 |
| 2020's | 25 |
| - = No Data Reported; -- = Not Applicable; NA = Not Available; W = Withheld to avoid disclosure of individual company data. |
| Release Date: 2/9/2022 |
| Next Release Date: Suspended |