|
Download Data (XLS File) |
|
|||||
|
|||||
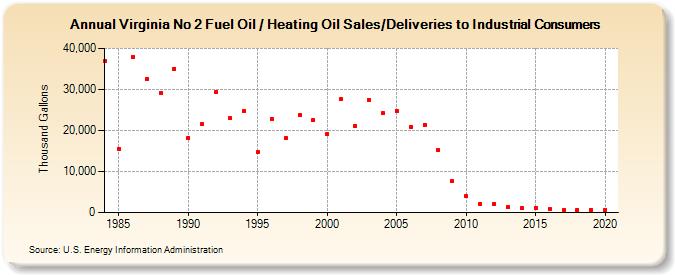
| Virginia No 2 Fuel Oil / Heating Oil Sales/Deliveries to Industrial Consumers (Thousand Gallons) | |||||
| Decade | Year-0 | Year-1 | Year-2 | Year-3 | Year-4 | Year-5 | Year-6 | Year-7 | Year-8 | Year-9 |
|---|---|---|---|---|---|---|---|---|---|---|
| 1980's | 37,004 | 15,524 | 37,957 | 32,591 | 29,109 | 35,081 | ||||
| 1990's | 18,275 | 21,467 | 29,385 | 23,013 | 24,739 | 14,851 | 22,802 | 18,243 | 23,783 | 22,519 |
| 2000's | 19,165 | 27,720 | 21,150 | 27,515 | 24,137 | 24,862 | 20,933 | 21,396 | 15,257 | 7,578 |
| 2010's | 3,919 | 2,131 | 2,098 | 1,298 | 1,153 | 1,180 | 882 | 713 | 621 | 644 |
| 2020's | 744 |
| - = No Data Reported; -- = Not Applicable; NA = Not Available; W = Withheld to avoid disclosure of individual company data. |
| Release Date: 2/9/2022 |
| Next Release Date: Suspended |