|
Download Data (XLS File) |
|
|||||
|
|||||
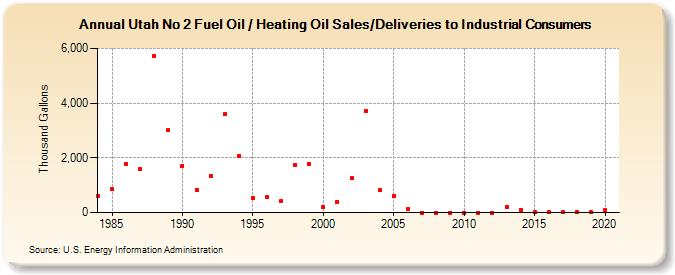
| Utah No 2 Fuel Oil / Heating Oil Sales/Deliveries to Industrial Consumers (Thousand Gallons) | |||||
| Decade | Year-0 | Year-1 | Year-2 | Year-3 | Year-4 | Year-5 | Year-6 | Year-7 | Year-8 | Year-9 |
|---|---|---|---|---|---|---|---|---|---|---|
| 1980's | 603 | 848 | 1,781 | 1,578 | 5,720 | 3,014 | ||||
| 1990's | 1,711 | 826 | 1,350 | 3,596 | 2,061 | 531 | 563 | 416 | 1,729 | 1,787 |
| 2000's | 202 | 387 | 1,248 | 3,725 | 815 | 613 | 116 | 0 | 0 | 0 |
| 2010's | 0 | 0 | 0 | 206 | 102 | 22 | 24 | 13 | 21 | 11 |
| 2020's | 104 |
| - = No Data Reported; -- = Not Applicable; NA = Not Available; W = Withheld to avoid disclosure of individual company data. |
| Release Date: 2/9/2022 |
| Next Release Date: Suspended |