|
Download Data (XLS File) |
|
|||||
|
|||||
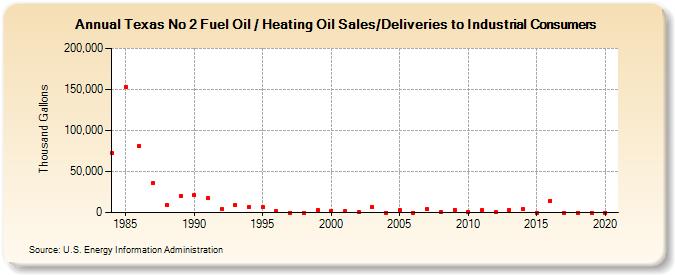
| Texas No 2 Fuel Oil / Heating Oil Sales/Deliveries to Industrial Consumers (Thousand Gallons) | |||||
| Decade | Year-0 | Year-1 | Year-2 | Year-3 | Year-4 | Year-5 | Year-6 | Year-7 | Year-8 | Year-9 |
|---|---|---|---|---|---|---|---|---|---|---|
| 1980's | 72,031 | 153,208 | 81,466 | 36,083 | 8,607 | 20,064 | ||||
| 1990's | 20,966 | 17,141 | 4,411 | 9,042 | 7,182 | 6,550 | 1,412 | 0 | 24 | 2,975 |
| 2000's | 1,977 | 1,359 | 131 | 6,748 | 72 | 3,083 | 0 | 3,912 | 966 | 3,436 |
| 2010's | 420 | 2,715 | 423 | 3,293 | 4,274 | 0 | 14,667 | 0 | 0 | 0 |
| 2020's | 0 |
| - = No Data Reported; -- = Not Applicable; NA = Not Available; W = Withheld to avoid disclosure of individual company data. |
| Release Date: 2/9/2022 |
| Next Release Date: Suspended |