|
Download Data (XLS File) |
|
|||||
|
|||||
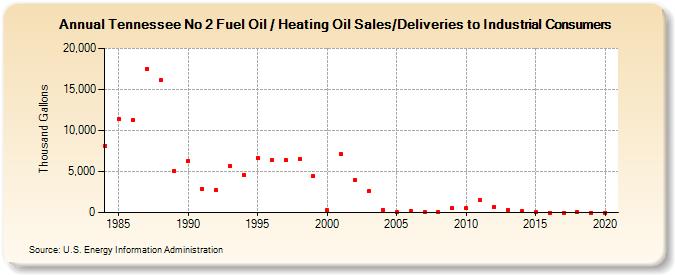
| Tennessee No 2 Fuel Oil / Heating Oil Sales/Deliveries to Industrial Consumers (Thousand Gallons) | |||||
| Decade | Year-0 | Year-1 | Year-2 | Year-3 | Year-4 | Year-5 | Year-6 | Year-7 | Year-8 | Year-9 |
|---|---|---|---|---|---|---|---|---|---|---|
| 1980's | 8,157 | 11,411 | 11,227 | 17,531 | 16,107 | 5,122 | ||||
| 1990's | 6,288 | 2,917 | 2,689 | 5,659 | 4,634 | 6,656 | 6,400 | 6,383 | 6,525 | 4,432 |
| 2000's | 266 | 7,081 | 3,937 | 2,622 | 323 | 68 | 131 | 101 | 65 | 531 |
| 2010's | 523 | 1,488 | 678 | 325 | 171 | 36 | 3 | 2 | 49 | 0 |
| 2020's | 0 |
| - = No Data Reported; -- = Not Applicable; NA = Not Available; W = Withheld to avoid disclosure of individual company data. |
| Release Date: 2/9/2022 |
| Next Release Date: Suspended |