|
Download Data (XLS File) |
|
|||||
|
|||||
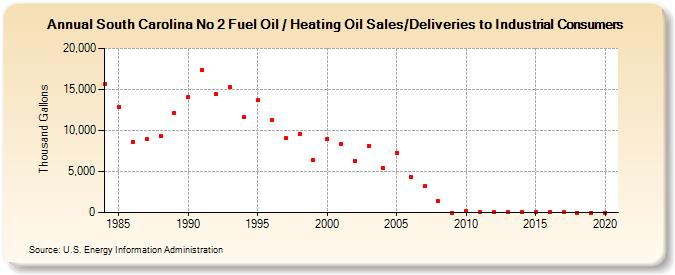
| South Carolina No 2 Fuel Oil / Heating Oil Sales/Deliveries to Industrial Consumers (Thousand Gallons) | |||||
| Decade | Year-0 | Year-1 | Year-2 | Year-3 | Year-4 | Year-5 | Year-6 | Year-7 | Year-8 | Year-9 |
|---|---|---|---|---|---|---|---|---|---|---|
| 1980's | 15,661 | 12,911 | 8,608 | 8,911 | 9,347 | 12,142 | ||||
| 1990's | 14,041 | 17,352 | 14,385 | 15,267 | 11,609 | 13,677 | 11,255 | 9,060 | 9,625 | 6,361 |
| 2000's | 9,003 | 8,378 | 6,313 | 8,141 | 5,482 | 7,288 | 4,341 | 3,199 | 1,381 | 5 |
| 2010's | 162 | 22 | 29 | 16 | 14 | 37 | 27 | 28 | 0 | 1 |
| 2020's | 0 |
| - = No Data Reported; -- = Not Applicable; NA = Not Available; W = Withheld to avoid disclosure of individual company data. |
| Release Date: 2/9/2022 |
| Next Release Date: Suspended |