|
Download Data (XLS File) |
|
|||||
|
|||||
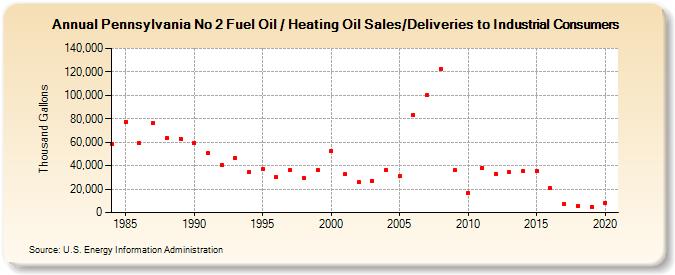
| Pennsylvania No 2 Fuel Oil / Heating Oil Sales/Deliveries to Industrial Consumers (Thousand Gallons) | |||||
| Decade | Year-0 | Year-1 | Year-2 | Year-3 | Year-4 | Year-5 | Year-6 | Year-7 | Year-8 | Year-9 |
|---|---|---|---|---|---|---|---|---|---|---|
| 1980's | 58,093 | 77,586 | 59,292 | 76,524 | 63,747 | 63,058 | ||||
| 1990's | 59,628 | 50,461 | 40,786 | 46,622 | 34,186 | 36,763 | 30,491 | 36,431 | 29,517 | 36,143 |
| 2000's | 52,488 | 32,622 | 25,819 | 27,158 | 36,638 | 30,886 | 83,296 | 99,978 | 122,708 | 36,078 |
| 2010's | 16,504 | 37,829 | 33,037 | 34,337 | 35,419 | 35,597 | 20,568 | 6,879 | 6,009 | 5,139 |
| 2020's | 8,427 |
| - = No Data Reported; -- = Not Applicable; NA = Not Available; W = Withheld to avoid disclosure of individual company data. |
| Release Date: 2/9/2022 |
| Next Release Date: Suspended |