|
Download Data (XLS File) |
|
|||||
|
|||||
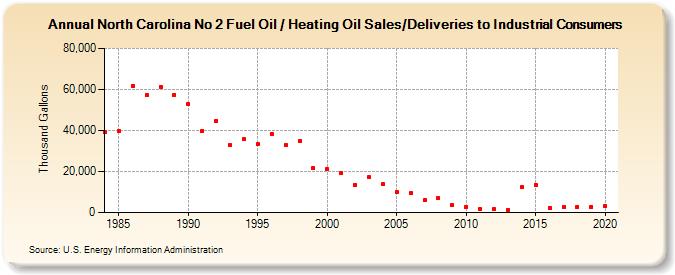
| North Carolina No 2 Fuel Oil / Heating Oil Sales/Deliveries to Industrial Consumers (Thousand Gallons) | |||||
| Decade | Year-0 | Year-1 | Year-2 | Year-3 | Year-4 | Year-5 | Year-6 | Year-7 | Year-8 | Year-9 |
|---|---|---|---|---|---|---|---|---|---|---|
| 1980's | 39,144 | 39,754 | 61,685 | 57,395 | 61,226 | 57,451 | ||||
| 1990's | 52,811 | 39,763 | 44,790 | 32,927 | 35,712 | 33,195 | 38,400 | 32,933 | 34,928 | 21,601 |
| 2000's | 21,137 | 19,363 | 13,592 | 17,206 | 13,874 | 9,985 | 9,357 | 5,959 | 6,976 | 3,670 |
| 2010's | 2,600 | 1,504 | 1,526 | 1,425 | 12,376 | 13,479 | 2,344 | 2,932 | 2,882 | 2,869 |
| 2020's | 3,428 |
| - = No Data Reported; -- = Not Applicable; NA = Not Available; W = Withheld to avoid disclosure of individual company data. |
| Release Date: 2/9/2022 |
| Next Release Date: Suspended |