|
Download Data (XLS File) |
|
|||||
|
|||||
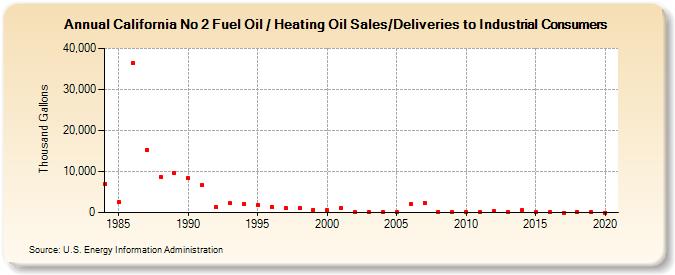
| California No 2 Fuel Oil / Heating Oil Sales/Deliveries to Industrial Consumers (Thousand Gallons) | |||||
| Decade | Year-0 | Year-1 | Year-2 | Year-3 | Year-4 | Year-5 | Year-6 | Year-7 | Year-8 | Year-9 |
|---|---|---|---|---|---|---|---|---|---|---|
| 1980's | 7,008 | 2,547 | 36,428 | 15,313 | 8,688 | 9,683 | ||||
| 1990's | 8,419 | 6,659 | 1,281 | 2,266 | 2,048 | 1,877 | 1,427 | 1,154 | 1,085 | 660 |
| 2000's | 530 | 1,199 | 152 | 31 | 35 | 106 | 2,198 | 2,405 | 226 | 66 |
| 2010's | 96 | 83 | 325 | 95 | 550 | 109 | 73 | 0 | 114 | 139 |
| 2020's | 0 |
| - = No Data Reported; -- = Not Applicable; NA = Not Available; W = Withheld to avoid disclosure of individual company data. |
| Release Date: 2/9/2022 |
| Next Release Date: Suspended |