|
Download Data (XLS File) |
|
|||||
|
|||||
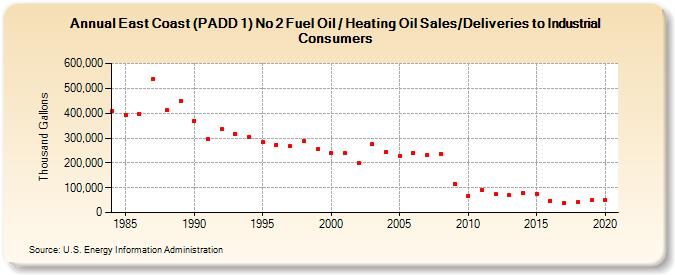
| East Coast (PADD 1) No 2 Fuel Oil / Heating Oil Sales/Deliveries to Industrial Consumers (Thousand Gallons) | |||||
| Decade | Year-0 | Year-1 | Year-2 | Year-3 | Year-4 | Year-5 | Year-6 | Year-7 | Year-8 | Year-9 |
|---|---|---|---|---|---|---|---|---|---|---|
| 1980's | 406,922 | 390,786 | 396,820 | 537,270 | 411,223 | 449,900 | ||||
| 1990's | 370,054 | 294,655 | 334,521 | 315,805 | 304,762 | 282,987 | 273,647 | 268,283 | 288,983 | 254,782 |
| 2000's | 239,808 | 238,023 | 199,862 | 273,967 | 243,547 | 226,728 | 240,071 | 231,733 | 236,100 | 114,261 |
| 2010's | 68,534 | 90,004 | 74,458 | 68,746 | 78,368 | 75,710 | 48,372 | 38,489 | 41,092 | 48,974 |
| 2020's | 49,057 |
| - = No Data Reported; -- = Not Applicable; NA = Not Available; W = Withheld to avoid disclosure of individual company data. |
| Release Date: 2/9/2022 |
| Next Release Date: Suspended |