|
Download Data (XLS File) |
|
|||||
|
|||||
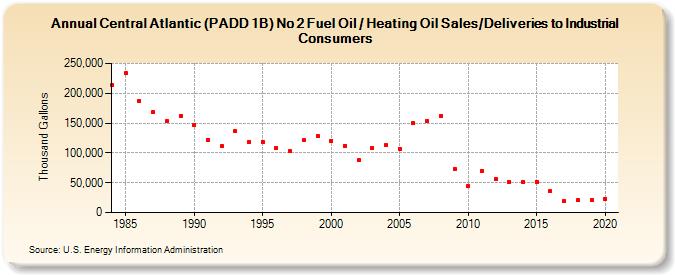
| Central Atlantic (PADD 1B) No 2 Fuel Oil / Heating Oil Sales/Deliveries to Industrial Consumers (Thousand Gallons) | |||||
| Decade | Year-0 | Year-1 | Year-2 | Year-3 | Year-4 | Year-5 | Year-6 | Year-7 | Year-8 | Year-9 |
|---|---|---|---|---|---|---|---|---|---|---|
| 1980's | 213,444 | 233,442 | 187,248 | 168,084 | 153,077 | 162,553 | ||||
| 1990's | 147,440 | 122,406 | 111,953 | 136,714 | 118,652 | 118,508 | 108,667 | 102,795 | 121,015 | 129,020 |
| 2000's | 120,477 | 112,077 | 87,600 | 107,903 | 113,355 | 107,384 | 150,182 | 153,625 | 161,714 | 73,526 |
| 2010's | 44,858 | 70,270 | 55,948 | 51,517 | 51,476 | 51,737 | 35,712 | 19,692 | 20,236 | 20,806 |
| 2020's | 23,365 |
| - = No Data Reported; -- = Not Applicable; NA = Not Available; W = Withheld to avoid disclosure of individual company data. |
| Release Date: 2/9/2022 |
| Next Release Date: Suspended |