|
Download Data (XLS File) |
|
|||||
|
|||||
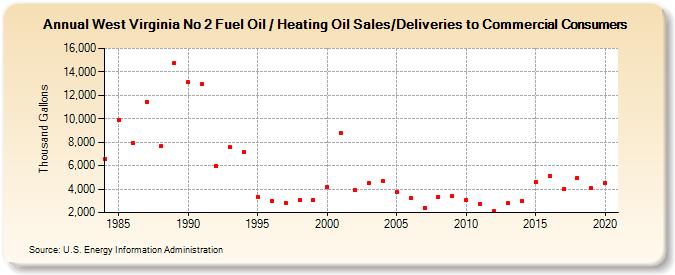
| West Virginia No 2 Fuel Oil / Heating Oil Sales/Deliveries to Commercial Consumers (Thousand Gallons) | |||||
| Decade | Year-0 | Year-1 | Year-2 | Year-3 | Year-4 | Year-5 | Year-6 | Year-7 | Year-8 | Year-9 |
|---|---|---|---|---|---|---|---|---|---|---|
| 1980's | 6,586 | 9,921 | 7,971 | 11,437 | 7,644 | 14,719 | ||||
| 1990's | 13,095 | 12,971 | 5,949 | 7,571 | 7,166 | 3,351 | 3,005 | 2,834 | 3,076 | 3,038 |
| 2000's | 4,171 | 8,795 | 3,962 | 4,504 | 4,668 | 3,740 | 3,223 | 2,425 | 3,306 | 3,395 |
| 2010's | 3,105 | 2,736 | 2,102 | 2,792 | 2,995 | 4,596 | 5,144 | 3,989 | 4,967 | 4,070 |
| 2020's | 4,514 |
| - = No Data Reported; -- = Not Applicable; NA = Not Available; W = Withheld to avoid disclosure of individual company data. |
| Release Date: 2/9/2022 |
| Next Release Date: Suspended |