|
Download Data (XLS File) |
|
|||||
|
|||||
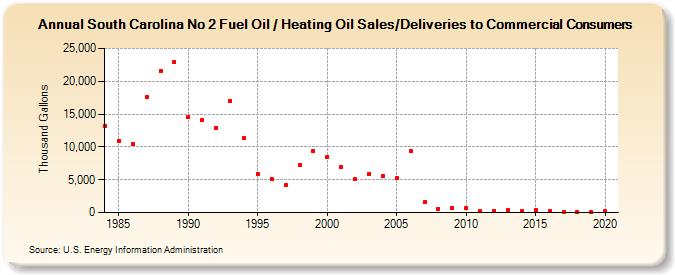
| South Carolina No 2 Fuel Oil / Heating Oil Sales/Deliveries to Commercial Consumers (Thousand Gallons) | |||||
| Decade | Year-0 | Year-1 | Year-2 | Year-3 | Year-4 | Year-5 | Year-6 | Year-7 | Year-8 | Year-9 |
|---|---|---|---|---|---|---|---|---|---|---|
| 1980's | 13,254 | 10,903 | 10,469 | 17,626 | 21,604 | 22,926 | ||||
| 1990's | 14,480 | 14,099 | 12,916 | 16,958 | 11,423 | 5,916 | 5,138 | 4,226 | 7,173 | 9,360 |
| 2000's | 8,527 | 6,913 | 5,040 | 5,928 | 5,617 | 5,190 | 9,447 | 1,578 | 568 | 674 |
| 2010's | 706 | 166 | 293 | 365 | 234 | 455 | 165 | 124 | 122 | 141 |
| 2020's | 172 |
| - = No Data Reported; -- = Not Applicable; NA = Not Available; W = Withheld to avoid disclosure of individual company data. |
| Release Date: 2/9/2022 |
| Next Release Date: Suspended |