|
Download Data (XLS File) |
|
|||||
|
|||||
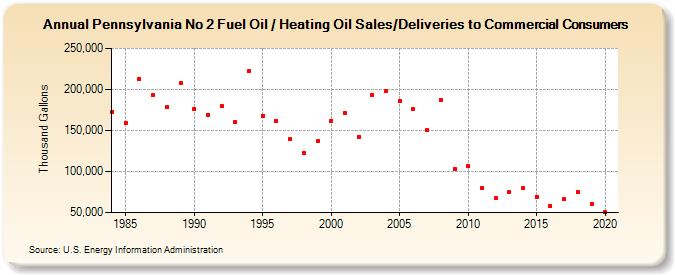
| Pennsylvania No 2 Fuel Oil / Heating Oil Sales/Deliveries to Commercial Consumers (Thousand Gallons) | |||||
| Decade | Year-0 | Year-1 | Year-2 | Year-3 | Year-4 | Year-5 | Year-6 | Year-7 | Year-8 | Year-9 |
|---|---|---|---|---|---|---|---|---|---|---|
| 1980's | 172,694 | 159,129 | 212,151 | 192,619 | 178,386 | 207,234 | ||||
| 1990's | 176,530 | 168,853 | 179,659 | 160,473 | 222,430 | 168,074 | 161,872 | 139,241 | 122,424 | 136,698 |
| 2000's | 161,848 | 171,480 | 142,557 | 193,622 | 198,266 | 185,348 | 175,814 | 150,019 | 187,302 | 102,462 |
| 2010's | 107,321 | 80,008 | 67,703 | 74,745 | 80,391 | 69,509 | 58,043 | 65,970 | 75,002 | 60,657 |
| 2020's | 50,757 |
| - = No Data Reported; -- = Not Applicable; NA = Not Available; W = Withheld to avoid disclosure of individual company data. |
| Release Date: 2/9/2022 |
| Next Release Date: Suspended |