|
Download Data (XLS File) |
|
|||||
|
|||||
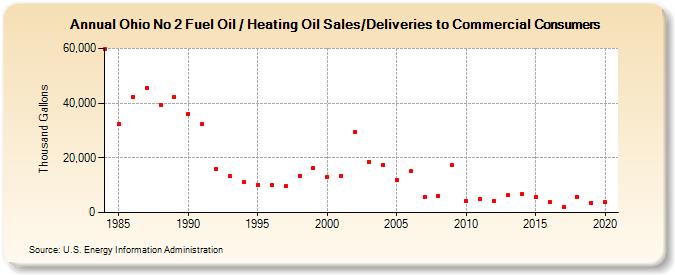
| Ohio No 2 Fuel Oil / Heating Oil Sales/Deliveries to Commercial Consumers (Thousand Gallons) | |||||
| Decade | Year-0 | Year-1 | Year-2 | Year-3 | Year-4 | Year-5 | Year-6 | Year-7 | Year-8 | Year-9 |
|---|---|---|---|---|---|---|---|---|---|---|
| 1980's | 59,672 | 32,238 | 42,369 | 45,431 | 39,460 | 42,365 | ||||
| 1990's | 36,204 | 32,263 | 15,971 | 13,190 | 11,098 | 10,227 | 10,142 | 9,730 | 13,498 | 16,199 |
| 2000's | 13,050 | 13,390 | 29,573 | 18,615 | 17,491 | 11,999 | 15,083 | 5,626 | 6,087 | 17,387 |
| 2010's | 4,236 | 4,873 | 4,316 | 6,328 | 6,918 | 5,759 | 3,807 | 1,956 | 5,631 | 3,638 |
| 2020's | 3,893 |
| - = No Data Reported; -- = Not Applicable; NA = Not Available; W = Withheld to avoid disclosure of individual company data. |
| Release Date: 2/9/2022 |
| Next Release Date: Suspended |