|
Download Data (XLS File) |
|
|||||
|
|||||
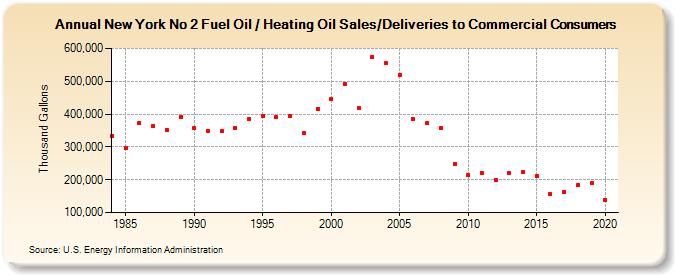
| New York No 2 Fuel Oil / Heating Oil Sales/Deliveries to Commercial Consumers (Thousand Gallons) | |||||
| Decade | Year-0 | Year-1 | Year-2 | Year-3 | Year-4 | Year-5 | Year-6 | Year-7 | Year-8 | Year-9 |
|---|---|---|---|---|---|---|---|---|---|---|
| 1980's | 333,209 | 295,676 | 372,928 | 363,909 | 351,035 | 392,057 | ||||
| 1990's | 356,321 | 349,838 | 348,121 | 357,876 | 385,117 | 395,242 | 390,255 | 394,639 | 342,036 | 416,429 |
| 2000's | 444,360 | 491,719 | 418,049 | 574,401 | 554,454 | 519,839 | 384,783 | 371,469 | 358,733 | 247,093 |
| 2010's | 213,692 | 220,182 | 199,323 | 220,113 | 223,634 | 212,463 | 156,479 | 163,410 | 183,153 | 188,810 |
| 2020's | 139,023 |
| - = No Data Reported; -- = Not Applicable; NA = Not Available; W = Withheld to avoid disclosure of individual company data. |
| Release Date: 2/9/2022 |
| Next Release Date: Suspended |