|
Download Data (XLS File) |
|
|||||
|
|||||
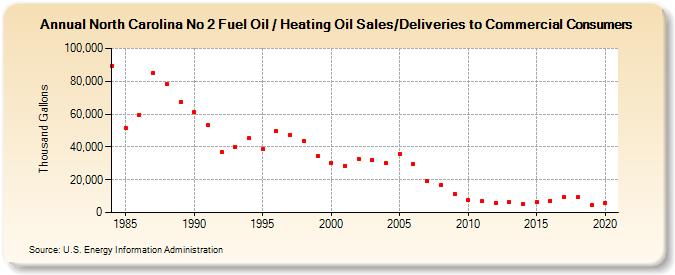
| North Carolina No 2 Fuel Oil / Heating Oil Sales/Deliveries to Commercial Consumers (Thousand Gallons) | |||||
| Decade | Year-0 | Year-1 | Year-2 | Year-3 | Year-4 | Year-5 | Year-6 | Year-7 | Year-8 | Year-9 |
|---|---|---|---|---|---|---|---|---|---|---|
| 1980's | 89,356 | 51,677 | 59,671 | 85,165 | 78,077 | 67,244 | ||||
| 1990's | 61,158 | 53,585 | 36,833 | 40,127 | 45,174 | 38,609 | 49,792 | 47,419 | 43,730 | 34,616 |
| 2000's | 30,422 | 28,618 | 32,887 | 32,022 | 30,156 | 35,881 | 29,766 | 18,962 | 16,581 | 11,295 |
| 2010's | 7,527 | 6,836 | 6,001 | 6,266 | 5,479 | 6,384 | 7,205 | 9,306 | 9,276 | 4,566 |
| 2020's | 5,822 |
| - = No Data Reported; -- = Not Applicable; NA = Not Available; W = Withheld to avoid disclosure of individual company data. |
| Release Date: 2/9/2022 |
| Next Release Date: Suspended |