|
Download Data (XLS File) |
|
|||||
|
|||||
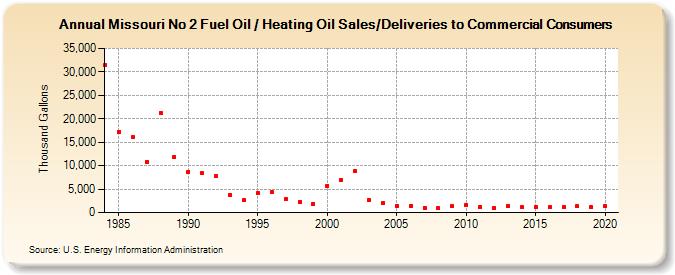
| Missouri No 2 Fuel Oil / Heating Oil Sales/Deliveries to Commercial Consumers (Thousand Gallons) | |||||
| Decade | Year-0 | Year-1 | Year-2 | Year-3 | Year-4 | Year-5 | Year-6 | Year-7 | Year-8 | Year-9 |
|---|---|---|---|---|---|---|---|---|---|---|
| 1980's | 31,471 | 17,231 | 16,042 | 10,820 | 21,281 | 11,838 | ||||
| 1990's | 8,726 | 8,340 | 7,731 | 3,825 | 2,599 | 4,213 | 4,282 | 2,797 | 2,305 | 1,878 |
| 2000's | 5,725 | 7,036 | 8,886 | 2,682 | 2,026 | 1,424 | 1,477 | 1,053 | 954 | 1,304 |
| 2010's | 1,604 | 1,268 | 1,074 | 1,345 | 1,113 | 1,111 | 1,133 | 1,177 | 1,338 | 1,158 |
| 2020's | 1,299 |
| - = No Data Reported; -- = Not Applicable; NA = Not Available; W = Withheld to avoid disclosure of individual company data. |
| Release Date: 2/9/2022 |
| Next Release Date: Suspended |