|
Download Data (XLS File) |
|
|||||
|
|||||
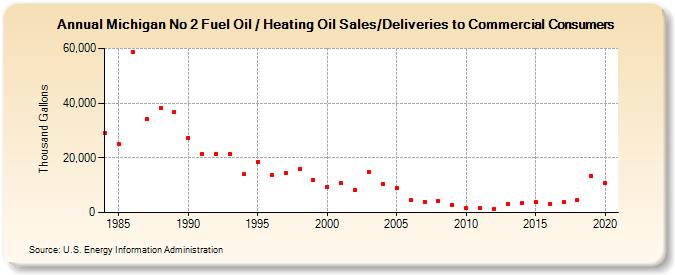
| Michigan No 2 Fuel Oil / Heating Oil Sales/Deliveries to Commercial Consumers (Thousand Gallons) | |||||
| Decade | Year-0 | Year-1 | Year-2 | Year-3 | Year-4 | Year-5 | Year-6 | Year-7 | Year-8 | Year-9 |
|---|---|---|---|---|---|---|---|---|---|---|
| 1980's | 29,170 | 25,028 | 58,812 | 34,242 | 38,127 | 36,848 | ||||
| 1990's | 27,415 | 21,551 | 21,566 | 21,364 | 13,955 | 18,620 | 13,812 | 14,371 | 15,884 | 12,082 |
| 2000's | 9,450 | 10,856 | 8,167 | 14,931 | 10,602 | 8,815 | 4,677 | 4,042 | 4,110 | 2,881 |
| 2010's | 1,649 | 1,740 | 1,391 | 3,116 | 3,473 | 3,885 | 3,284 | 3,912 | 4,506 | 13,428 |
| 2020's | 10,666 |
| - = No Data Reported; -- = Not Applicable; NA = Not Available; W = Withheld to avoid disclosure of individual company data. |
| Release Date: 2/9/2022 |
| Next Release Date: Suspended |