|
Download Data (XLS File) |
|
|||||
|
|||||
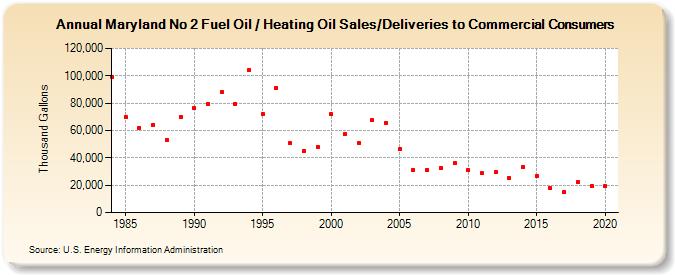
| Maryland No 2 Fuel Oil / Heating Oil Sales/Deliveries to Commercial Consumers (Thousand Gallons) | |||||
| Decade | Year-0 | Year-1 | Year-2 | Year-3 | Year-4 | Year-5 | Year-6 | Year-7 | Year-8 | Year-9 |
|---|---|---|---|---|---|---|---|---|---|---|
| 1980's | 99,118 | 69,908 | 62,015 | 64,252 | 53,041 | 69,886 | ||||
| 1990's | 76,286 | 79,695 | 88,272 | 79,700 | 104,052 | 72,078 | 91,252 | 50,552 | 44,844 | 48,226 |
| 2000's | 72,022 | 57,694 | 50,880 | 67,536 | 65,780 | 46,388 | 31,219 | 31,353 | 32,806 | 35,977 |
| 2010's | 31,058 | 28,664 | 29,517 | 25,112 | 33,653 | 26,991 | 17,784 | 14,989 | 22,336 | 19,152 |
| 2020's | 19,467 |
| - = No Data Reported; -- = Not Applicable; NA = Not Available; W = Withheld to avoid disclosure of individual company data. |
| Release Date: 2/9/2022 |
| Next Release Date: Suspended |