|
Download Data (XLS File) |
|
|||||
|
|||||
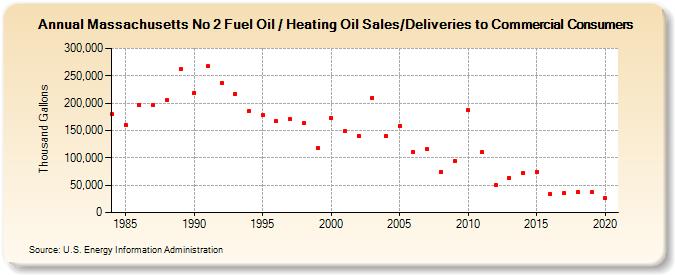
| Massachusetts No 2 Fuel Oil / Heating Oil Sales/Deliveries to Commercial Consumers (Thousand Gallons) | |||||
| Decade | Year-0 | Year-1 | Year-2 | Year-3 | Year-4 | Year-5 | Year-6 | Year-7 | Year-8 | Year-9 |
|---|---|---|---|---|---|---|---|---|---|---|
| 1980's | 179,264 | 159,645 | 195,765 | 196,368 | 205,987 | 261,552 | ||||
| 1990's | 219,182 | 267,306 | 237,253 | 217,008 | 185,690 | 177,374 | 166,405 | 170,306 | 162,992 | 118,005 |
| 2000's | 173,621 | 148,333 | 140,222 | 209,679 | 139,511 | 158,759 | 110,335 | 115,319 | 73,694 | 94,219 |
| 2010's | 186,885 | 110,535 | 49,800 | 63,851 | 72,203 | 74,389 | 33,749 | 34,910 | 37,312 | 37,023 |
| 2020's | 26,028 |
| - = No Data Reported; -- = Not Applicable; NA = Not Available; W = Withheld to avoid disclosure of individual company data. |
| Release Date: 2/9/2022 |
| Next Release Date: Suspended |