|
Download Data (XLS File) |
|
|||||
|
|||||
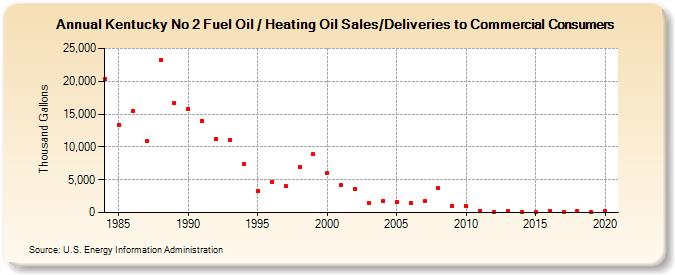
| Kentucky No 2 Fuel Oil / Heating Oil Sales/Deliveries to Commercial Consumers (Thousand Gallons) | |||||
| Decade | Year-0 | Year-1 | Year-2 | Year-3 | Year-4 | Year-5 | Year-6 | Year-7 | Year-8 | Year-9 |
|---|---|---|---|---|---|---|---|---|---|---|
| 1980's | 20,357 | 13,380 | 15,435 | 10,849 | 23,214 | 16,696 | ||||
| 1990's | 15,760 | 14,019 | 11,257 | 11,084 | 7,460 | 3,274 | 4,620 | 4,033 | 6,920 | 8,851 |
| 2000's | 5,956 | 4,154 | 3,626 | 1,489 | 1,688 | 1,666 | 1,471 | 1,686 | 3,672 | 1,001 |
| 2010's | 974 | 287 | 103 | 244 | 153 | 82 | 213 | 77 | 162 | 84 |
| 2020's | 234 |
| - = No Data Reported; -- = Not Applicable; NA = Not Available; W = Withheld to avoid disclosure of individual company data. |
| Release Date: 2/9/2022 |
| Next Release Date: Suspended |