|
Download Data (XLS File) |
|
|||||
|
|||||
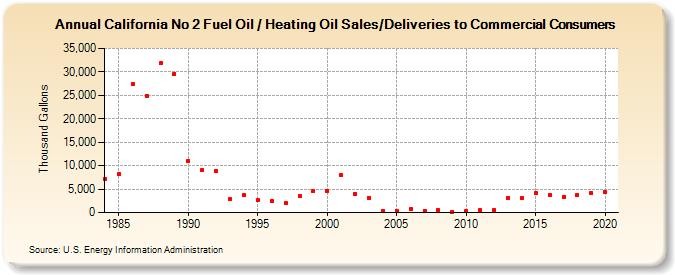
| California No 2 Fuel Oil / Heating Oil Sales/Deliveries to Commercial Consumers (Thousand Gallons) | |||||
| Decade | Year-0 | Year-1 | Year-2 | Year-3 | Year-4 | Year-5 | Year-6 | Year-7 | Year-8 | Year-9 |
|---|---|---|---|---|---|---|---|---|---|---|
| 1980's | 7,102 | 8,237 | 27,345 | 24,919 | 31,788 | 29,638 | ||||
| 1990's | 11,043 | 9,107 | 8,760 | 2,820 | 3,714 | 2,608 | 2,435 | 1,940 | 3,463 | 4,535 |
| 2000's | 4,670 | 7,941 | 4,017 | 3,166 | 366 | 411 | 665 | 426 | 445 | 226 |
| 2010's | 434 | 537 | 597 | 3,178 | 3,202 | 4,070 | 3,844 | 3,415 | 3,779 | 4,160 |
| 2020's | 4,378 |
| - = No Data Reported; -- = Not Applicable; NA = Not Available; W = Withheld to avoid disclosure of individual company data. |
| Release Date: 2/9/2022 |
| Next Release Date: Suspended |