|
Download Data (XLS File) |
|
|||||
|
|||||
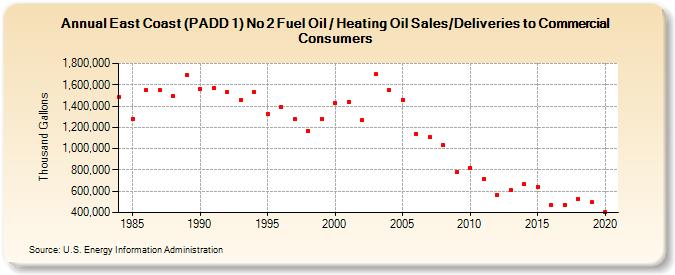
| East Coast (PADD 1) No 2 Fuel Oil / Heating Oil Sales/Deliveries to Commercial Consumers (Thousand Gallons) | |||||
| Decade | Year-0 | Year-1 | Year-2 | Year-3 | Year-4 | Year-5 | Year-6 | Year-7 | Year-8 | Year-9 |
|---|---|---|---|---|---|---|---|---|---|---|
| 1980's | 1,486,533 | 1,282,346 | 1,551,135 | 1,552,774 | 1,498,958 | 1,692,739 | ||||
| 1990's | 1,560,430 | 1,567,419 | 1,532,975 | 1,455,132 | 1,535,340 | 1,328,220 | 1,393,582 | 1,278,266 | 1,170,098 | 1,281,308 |
| 2000's | 1,429,053 | 1,442,961 | 1,265,635 | 1,696,785 | 1,550,700 | 1,457,145 | 1,142,428 | 1,111,562 | 1,034,786 | 781,398 |
| 2010's | 819,300 | 718,781 | 569,017 | 610,684 | 665,796 | 644,612 | 470,190 | 475,657 | 531,297 | 495,284 |
| 2020's | 409,881 |
| - = No Data Reported; -- = Not Applicable; NA = Not Available; W = Withheld to avoid disclosure of individual company data. |
| Release Date: 2/9/2022 |
| Next Release Date: Suspended |