|
Download Data (XLS File) |
|
|||||
|
|||||
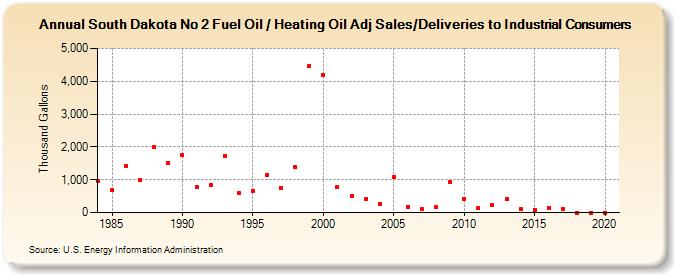
| South Dakota No 2 Fuel Oil / Heating Oil Adj Sales/Deliveries to Industrial Consumers (Thousand Gallons) | |||||
| Decade | Year-0 | Year-1 | Year-2 | Year-3 | Year-4 | Year-5 | Year-6 | Year-7 | Year-8 | Year-9 |
|---|---|---|---|---|---|---|---|---|---|---|
| 1980's | 968 | 684 | 1,430 | 978 | 1,994 | 1,506 | ||||
| 1990's | 1,749 | 784 | 842 | 1,730 | 605 | 663 | 1,158 | 757 | 1,387 | 4,464 |
| 2000's | 4,187 | 765 | 500 | 419 | 262 | 1,076 | 174 | 117 | 159 | 933 |
| 2010's | 403 | 134 | 235 | 410 | 99 | 90 | 151 | 122 | 0 | 0 |
| 2020's | 0 |
| - = No Data Reported; -- = Not Applicable; NA = Not Available; W = Withheld to avoid disclosure of individual company data. |
| Release Date: 2/9/2022 |
| Next Release Date: Suspended |