|
Download Data (XLS File) |
|
|||||
|
|||||
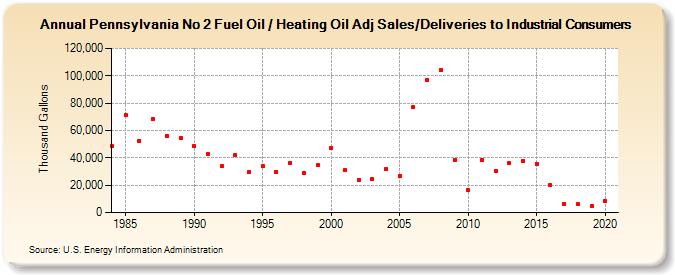
| Pennsylvania No 2 Fuel Oil / Heating Oil Adj Sales/Deliveries to Industrial Consumers (Thousand Gallons) | |||||
| Decade | Year-0 | Year-1 | Year-2 | Year-3 | Year-4 | Year-5 | Year-6 | Year-7 | Year-8 | Year-9 |
|---|---|---|---|---|---|---|---|---|---|---|
| 1980's | 48,426 | 70,976 | 52,614 | 68,249 | 56,071 | 54,854 | ||||
| 1990's | 48,518 | 43,146 | 33,994 | 42,087 | 29,362 | 33,884 | 29,899 | 36,282 | 28,760 | 34,410 |
| 2000's | 47,294 | 31,010 | 24,007 | 24,360 | 31,965 | 26,933 | 77,031 | 96,692 | 104,302 | 38,100 |
| 2010's | 16,144 | 38,499 | 30,204 | 36,055 | 37,845 | 35,790 | 19,869 | 6,428 | 5,899 | 5,111 |
| 2020's | 8,584 |
| - = No Data Reported; -- = Not Applicable; NA = Not Available; W = Withheld to avoid disclosure of individual company data. |
| Release Date: 2/9/2022 |
| Next Release Date: Suspended |