|
Download Data (XLS File) |
|
|||||
|
|||||
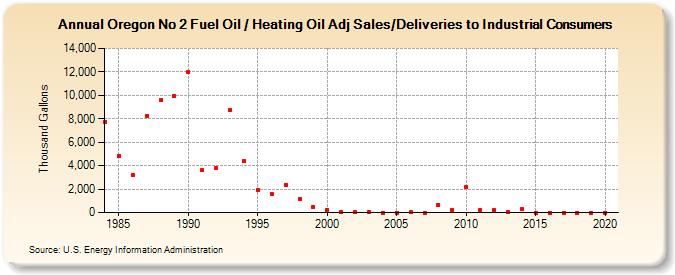
| Oregon No 2 Fuel Oil / Heating Oil Adj Sales/Deliveries to Industrial Consumers (Thousand Gallons) | |||||
| Decade | Year-0 | Year-1 | Year-2 | Year-3 | Year-4 | Year-5 | Year-6 | Year-7 | Year-8 | Year-9 |
|---|---|---|---|---|---|---|---|---|---|---|
| 1980's | 7,761 | 4,815 | 3,163 | 8,222 | 9,593 | 9,947 | ||||
| 1990's | 12,028 | 3,591 | 3,812 | 8,776 | 4,384 | 1,926 | 1,619 | 2,350 | 1,131 | 442 |
| 2000's | 224 | 34 | 8 | 7 | 4 | 5 | 9 | 3 | 643 | 187 |
| 2010's | 2,174 | 234 | 183 | 8 | 295 | 3 | 4 | 3 | 4 | 0 |
| 2020's | 3 |
| - = No Data Reported; -- = Not Applicable; NA = Not Available; W = Withheld to avoid disclosure of individual company data. |
| Release Date: 2/9/2022 |
| Next Release Date: Suspended |