|
Download Data (XLS File) |
|
|||||
|
|||||
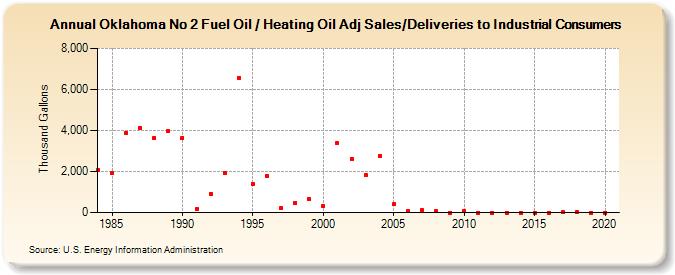
| Oklahoma No 2 Fuel Oil / Heating Oil Adj Sales/Deliveries to Industrial Consumers (Thousand Gallons) | |||||
| Decade | Year-0 | Year-1 | Year-2 | Year-3 | Year-4 | Year-5 | Year-6 | Year-7 | Year-8 | Year-9 |
|---|---|---|---|---|---|---|---|---|---|---|
| 1980's | 2,055 | 1,910 | 3,900 | 4,127 | 3,647 | 3,961 | ||||
| 1990's | 3,652 | 174 | 918 | 1,946 | 6,570 | 1,406 | 1,776 | 220 | 487 | 649 |
| 2000's | 306 | 3,366 | 2,621 | 1,819 | 2,750 | 396 | 71 | 123 | 53 | 0 |
| 2010's | 95 | 2 | 0 | 0 | 0 | 0 | 0 | 15 | 8 | 0 |
| 2020's | 0 |
| - = No Data Reported; -- = Not Applicable; NA = Not Available; W = Withheld to avoid disclosure of individual company data. |
| Release Date: 2/9/2022 |
| Next Release Date: Suspended |