|
Download Data (XLS File) |
|
|||||
|
|||||
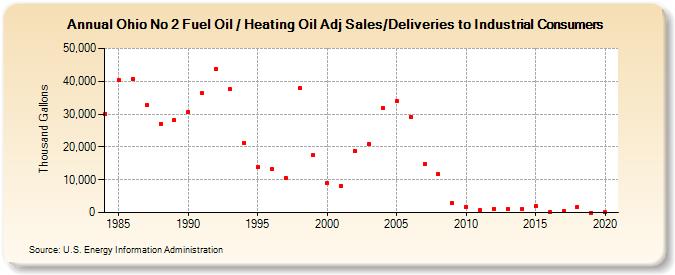
| Ohio No 2 Fuel Oil / Heating Oil Adj Sales/Deliveries to Industrial Consumers (Thousand Gallons) | |||||
| Decade | Year-0 | Year-1 | Year-2 | Year-3 | Year-4 | Year-5 | Year-6 | Year-7 | Year-8 | Year-9 |
|---|---|---|---|---|---|---|---|---|---|---|
| 1980's | 29,975 | 40,319 | 40,672 | 32,684 | 27,093 | 28,245 | ||||
| 1990's | 30,734 | 36,319 | 43,803 | 37,532 | 21,314 | 13,839 | 13,312 | 10,629 | 37,902 | 17,457 |
| 2000's | 9,055 | 8,098 | 18,840 | 21,030 | 31,778 | 33,911 | 29,126 | 14,733 | 11,676 | 2,984 |
| 2010's | 1,736 | 706 | 1,206 | 1,107 | 1,101 | 1,942 | 164 | 387 | 1,749 | 17 |
| 2020's | 36 |
| - = No Data Reported; -- = Not Applicable; NA = Not Available; W = Withheld to avoid disclosure of individual company data. |
| Release Date: 2/9/2022 |
| Next Release Date: Suspended |