|
Download Data (XLS File) |
|
|||||
|
|||||
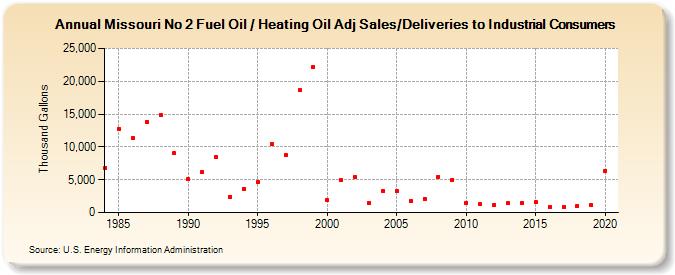
| Missouri No 2 Fuel Oil / Heating Oil Adj Sales/Deliveries to Industrial Consumers (Thousand Gallons) | |||||
| Decade | Year-0 | Year-1 | Year-2 | Year-3 | Year-4 | Year-5 | Year-6 | Year-7 | Year-8 | Year-9 |
|---|---|---|---|---|---|---|---|---|---|---|
| 1980's | 6,837 | 12,787 | 11,345 | 13,866 | 14,845 | 9,004 | ||||
| 1990's | 5,069 | 6,173 | 8,399 | 2,441 | 3,644 | 4,633 | 10,423 | 8,728 | 18,598 | 22,217 |
| 2000's | 1,893 | 4,917 | 5,385 | 1,466 | 3,302 | 3,227 | 1,766 | 2,132 | 5,480 | 5,028 |
| 2010's | 1,475 | 1,262 | 1,171 | 1,396 | 1,482 | 1,579 | 905 | 919 | 1,005 | 1,118 |
| 2020's | 6,370 |
| - = No Data Reported; -- = Not Applicable; NA = Not Available; W = Withheld to avoid disclosure of individual company data. |
| Release Date: 2/9/2022 |
| Next Release Date: Suspended |