|
Download Data (XLS File) |
|
|||||
|
|||||
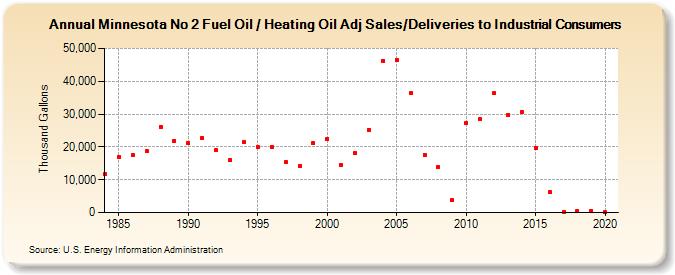
| Minnesota No 2 Fuel Oil / Heating Oil Adj Sales/Deliveries to Industrial Consumers (Thousand Gallons) | |||||
| Decade | Year-0 | Year-1 | Year-2 | Year-3 | Year-4 | Year-5 | Year-6 | Year-7 | Year-8 | Year-9 |
|---|---|---|---|---|---|---|---|---|---|---|
| 1980's | 11,638 | 16,873 | 17,606 | 18,669 | 26,190 | 21,814 | ||||
| 1990's | 21,173 | 22,836 | 18,913 | 16,064 | 21,373 | 20,031 | 19,942 | 15,374 | 14,247 | 21,083 |
| 2000's | 22,535 | 14,555 | 18,008 | 25,243 | 46,247 | 46,507 | 36,368 | 17,682 | 13,864 | 3,788 |
| 2010's | 27,237 | 28,389 | 36,285 | 29,778 | 30,651 | 19,728 | 6,246 | 296 | 442 | 543 |
| 2020's | 74 |
| - = No Data Reported; -- = Not Applicable; NA = Not Available; W = Withheld to avoid disclosure of individual company data. |
| Release Date: 2/9/2022 |
| Next Release Date: Suspended |