|
Download Data (XLS File) |
|
|||||
|
|||||
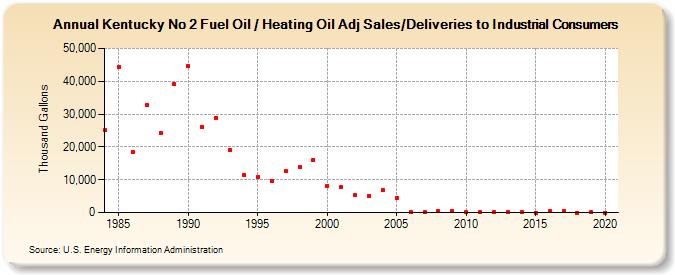
| Kentucky No 2 Fuel Oil / Heating Oil Adj Sales/Deliveries to Industrial Consumers (Thousand Gallons) | |||||
| Decade | Year-0 | Year-1 | Year-2 | Year-3 | Year-4 | Year-5 | Year-6 | Year-7 | Year-8 | Year-9 |
|---|---|---|---|---|---|---|---|---|---|---|
| 1980's | 25,034 | 44,378 | 18,484 | 32,627 | 24,208 | 39,010 | ||||
| 1990's | 44,566 | 26,203 | 28,897 | 19,106 | 11,353 | 10,836 | 9,632 | 12,577 | 14,016 | 16,148 |
| 2000's | 8,128 | 7,734 | 5,284 | 4,916 | 6,786 | 4,293 | 145 | 207 | 328 | 401 |
| 2010's | 30 | 74 | 25 | 57 | 46 | 0 | 330 | 361 | 0 | 26 |
| 2020's | 0 |
| - = No Data Reported; -- = Not Applicable; NA = Not Available; W = Withheld to avoid disclosure of individual company data. |
| Release Date: 2/9/2022 |
| Next Release Date: Suspended |