|
Download Data (XLS File) |
|
|||||
|
|||||
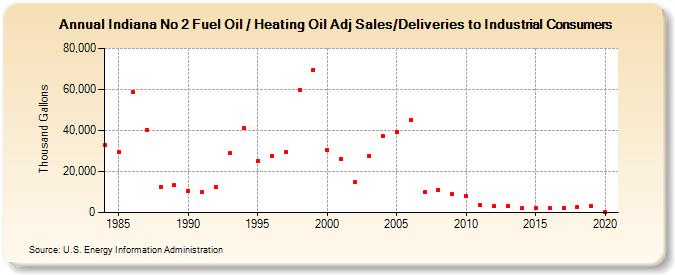
| Indiana No 2 Fuel Oil / Heating Oil Adj Sales/Deliveries to Industrial Consumers (Thousand Gallons) | |||||
| Decade | Year-0 | Year-1 | Year-2 | Year-3 | Year-4 | Year-5 | Year-6 | Year-7 | Year-8 | Year-9 |
|---|---|---|---|---|---|---|---|---|---|---|
| 1980's | 32,945 | 29,373 | 58,793 | 40,305 | 12,619 | 13,409 | ||||
| 1990's | 10,526 | 10,169 | 12,278 | 29,053 | 41,174 | 25,307 | 27,517 | 29,419 | 59,885 | 69,611 |
| 2000's | 30,581 | 26,141 | 14,678 | 27,328 | 37,343 | 39,156 | 45,191 | 9,874 | 11,229 | 8,816 |
| 2010's | 8,029 | 3,550 | 3,100 | 3,227 | 2,094 | 1,992 | 2,368 | 2,446 | 2,920 | 3,366 |
| 2020's | 276 |
| - = No Data Reported; -- = Not Applicable; NA = Not Available; W = Withheld to avoid disclosure of individual company data. |
| Release Date: 2/9/2022 |
| Next Release Date: Suspended |