|
Download Data (XLS File) |
|
|||||
|
|||||
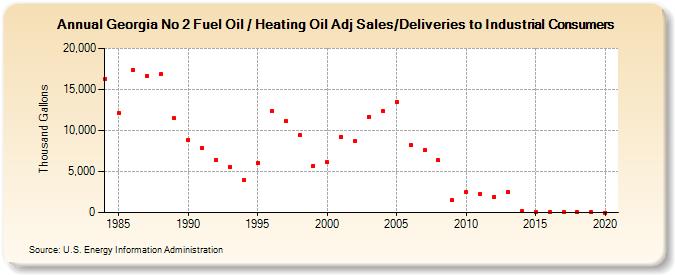
| Georgia No 2 Fuel Oil / Heating Oil Adj Sales/Deliveries to Industrial Consumers (Thousand Gallons) | |||||
| Decade | Year-0 | Year-1 | Year-2 | Year-3 | Year-4 | Year-5 | Year-6 | Year-7 | Year-8 | Year-9 |
|---|---|---|---|---|---|---|---|---|---|---|
| 1980's | 16,303 | 12,117 | 17,410 | 16,648 | 16,845 | 11,468 | ||||
| 1990's | 8,863 | 7,897 | 6,382 | 5,587 | 3,912 | 6,018 | 12,340 | 11,173 | 9,448 | 5,730 |
| 2000's | 6,108 | 9,236 | 8,666 | 11,676 | 12,340 | 13,495 | 8,253 | 7,607 | 6,362 | 1,478 |
| 2010's | 2,476 | 2,292 | 1,921 | 2,516 | 160 | 117 | 121 | 59 | 25 | 33 |
| 2020's | 0 |
| - = No Data Reported; -- = Not Applicable; NA = Not Available; W = Withheld to avoid disclosure of individual company data. |
| Release Date: 2/9/2022 |
| Next Release Date: Suspended |